Debugging
Level: Intermediate
Keywords: logs, bug, error, consoles, debugging, network
The result: where to find application logs, a guide for debugging
We all know that situation... Doesn't matter if you are just starting with SAMO implementation, or pretending to be an expert. It just happens. The application crashes down and you want to know WHY?! This short "manual" should prevent you from going crazy. And also from immediately calling someone else. Come on, you can handle this!
Software components versions
At first, it is important to know which versions of different software components are you using. We distinguish SAMO Platform consisting of Gateway, LIDS, User-service, Audit server, Elastic Search and Dynamic-App. Each standard SAMO Platform version consists of specific versions of software components, which can be checked in Lighthouse. Additionally, the versions can be checked in administration consoles or the application itself.
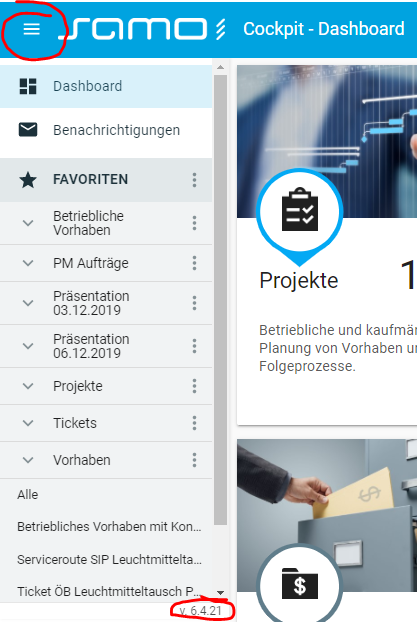
Dynamic-App version
location: the application menu
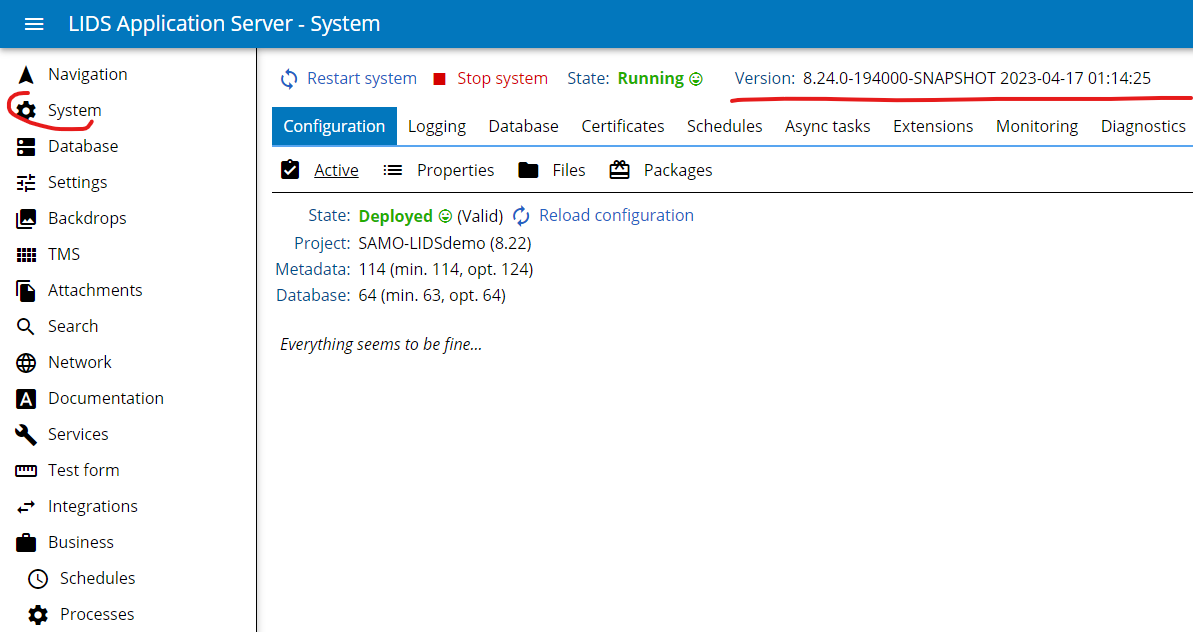
LIDS version
location: LIDS Administration console
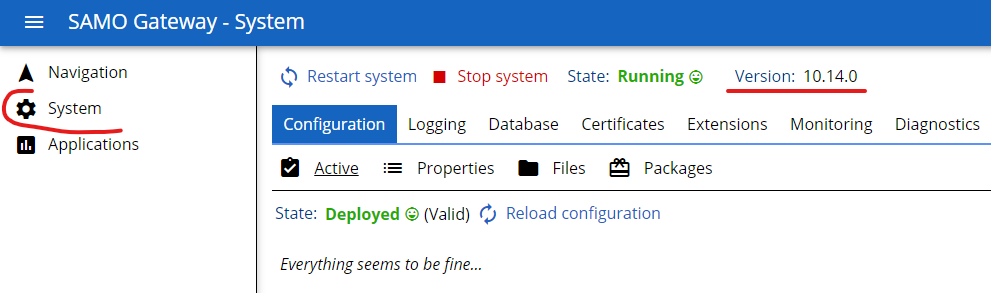
Gateway version
location: Gateway Administration console
The Health Check
When working in a locally running environment, you are usually still dependent on some software components, which are running on the project server. This is usually the case of Elastic Search and User Service, but depends on the way you start your local environment. If you have a suspicion, that some of your software components is not working properly, you can check it via the health check. Following there are example URL links for DEMO project:
- LIDS - http://ivp-samo-as1.assecosk.local:10380/as/rest/health
- Elastic Search - http://ivp-samo-as1.assecosk.local:10920/_cat/indices?v (working if indices are printed)
Administration Consoles
Apart from the software components version, [administration consoles] provide various kinds of logs or documentation, which can be useful for debugging. URL links for the consoles will be given for the locally running environment with standard ports setup.
LIDS Administration console
- location: http://localhost:10380/as/console/
- metadata, configuration errors, packages info: http://localhost:10380/as/console/#/system!view=configuration
- other logs: http://localhost:10380/as/console/#/system!view=logging
- choose weather to write logs to files or console
- rotate / clean log files
- set up the Level of logging (from off to all; default: info)
- documentation: http://localhost:10380/as/console/#/documentation
LIDS Security Manager
- location: http://localhost:10380/security/console/
LIDS License Server
- location: http://localhost:10380/license/console/
- license files: http://localhost:10380/license/console/#/license-files
Business Server console
-
metadata, configuration errors: http://localhost:10380/as/console/#/business
-
other logs: http://localhost:10380/as/console/#/business
-
documentation: http://localhost:10380/as/console/#/business
-
for fine logging using javaScript printed to LIDS cmd output include following code in your BS script:
    api.debug()
        .prepareOutput()
        .withDelimiter()
        .message("result")
        .addValue(result)
        .print();
Gateway Administration console
- location: http://localhost:10080/console
- metadata and configuration errors: http://localhost:10080/console#/configuration
- other logs: http://localhost:10080/console#/log
User Service Administration console
- location: http://localhost:10280/console/
- logs: http://localhost:10280/console/#/system!view=logging
Debugging in Internet Browser
All internet browsers have built in developer tools, which can be used for debugging. An examples in Google Chrome Browser follows. The simplest way to open up developer tools is pressing F12 key (or Ctrl+Shift+I in Opera, Command+Option+I in Safari). Developer tools provide multiple options and helpers, here are some most frequently used:
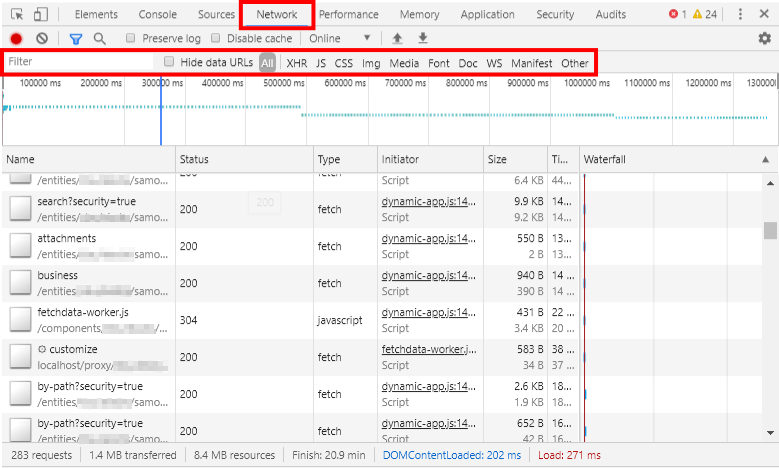
Network Activity
We can inspect the network activity in order to make sure that resources are being downloaded or uploaded as expected. Each row of the Network Log represents a resource. By default the resources are listed chronologically. The top resource is usually the main HTML document. The bottom resource is whatever was requested last. If you open Network Log only after the web page is loaded, it will be empty. You need to refresh the page in order to see the first downloaded resources or requests. You can filter the requests based on their type or name. In the overview table each column represents information about a resource. The default columns are:
- Status - The HTTP response code.
- Type - The resource type.
- Initiator - What caused a resource to be requested. Clicking a link in the Initiator column takes you to the source code that caused the request.
- Size - Overall downloaded or uploaded size of the request.
- Time - How long the request took.
- Waterfall - A graphical representation of the different stages of the request. Hoover over a Waterfall to see a breakdown.
You can also view each resource in detail. If you select some resource, you can check its Header, which contains for example the request URL or Request Payload (typically for search or by-path requests). Preview Tab contains structured response of the request. This can help you identify what is the content and result of the request and where is it being s
For SAMO there is one very important resource called samo-entities, which contains merged configuration metadata from samo-entities folder. Here you can find all the entity metadata, detail configurations, propertyGroups, intents, groups and others...
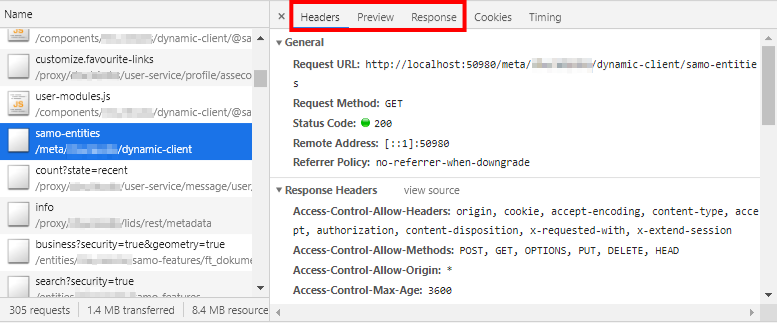
Then also in resources prefixed with ft_, cl_ or other names used in LIDS model you can see the LIDS metadata of mentioned feature type, codelist and other entities.
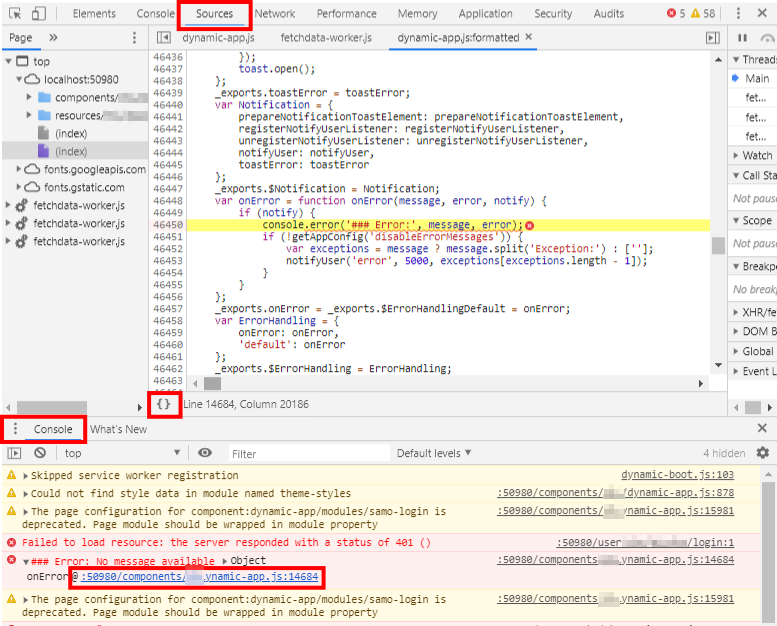
JavaScript Console
JavaScript console logs all errors, warnings and messages. Here you will also find information about deprecated metadata configurations or bad configuration. If you encounter an error, you can even navigate to the specific part of the complied source code by clicking on the available link. This may help you to understand the nature of encountered error. Using pretty print option for the code is highly recommended.
DOM Elements
To inspect web page elements right mouse click on desired element and > Inspect element. This will open up the developer console on Elements panel and locate desired element in HTML tree of the web page. If the selected element is a SAMO web module, you can access its configuration and data context. To do this, navigate in the HTML tree to the root tag of desired web module. Then open JavaScript console and type $0. Each web module has different options available.
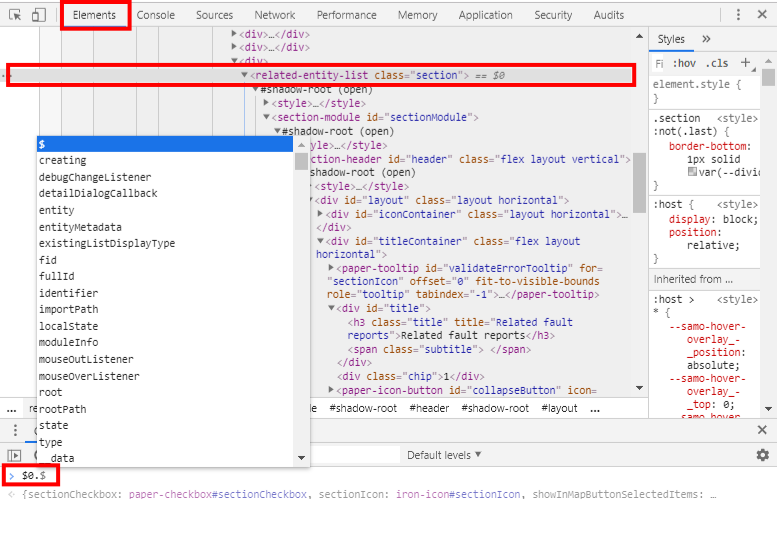
- Usually available options:
$0.configuration- available for all configurable SAMO modules$0.items- available for list modules$0.dataContext- available for most entities (e. g. detail sections, inputs, forms)$0.entityMetadata/$0.entitiesMetadata$0.entity- available for whole detail
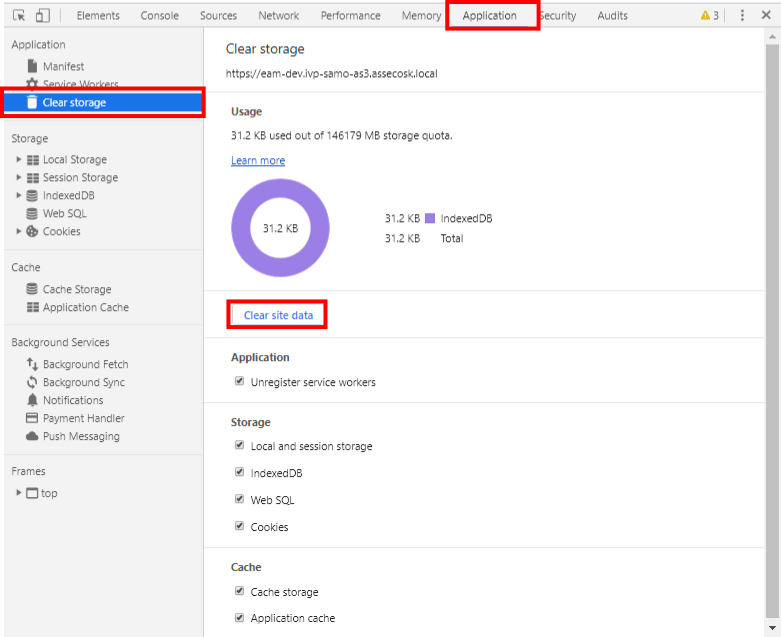
Clear Site Data
When debugging, it's helpful to clear all forms of persistent storage which a website is using. To clear all site data navigate to the Application Panel > Clear Storage > Clear Site Data.
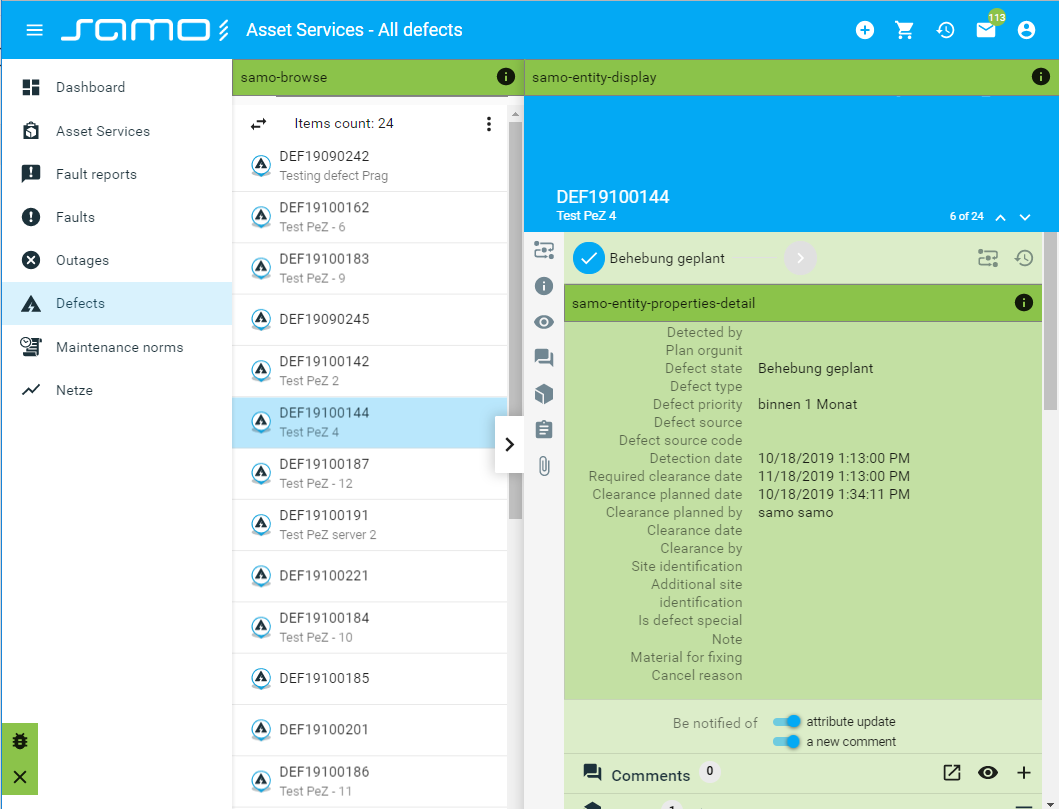
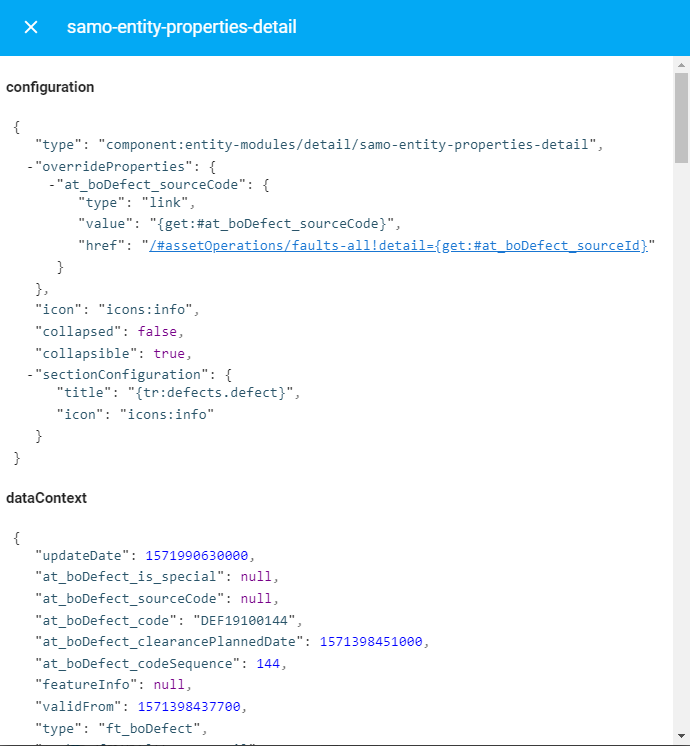
SAMO Debugging tool
SAMO Debugging tool provides more user friendly and aggregated view on some information, that can be harvested from internet browser debuggers. This tool can be switched on and off manually by clicking on "bug" or "X" icon in bottom left menu. After clicking on the "info" icon, SAMO Debugging tool will show the configuration of chosen SAMO web module and its current dataContext. To enable SAMO Debugging tool in your project, add dynamic_app_debug=true variable to the environment.properties file in your project environment repository. It is recommended to have this tool available for developement or test environments, but not for the production or presentation.