Dynamic ECharts diagrams
Level: Intermediate
Keywords: business action, implementation, echarts
The result: definition of dynamic diagrams in entity detail or dashboard
Prerequisities
What are Apache ECharts?
It is an open source library which allows you to configure your desired chart by JSON object.
You can select the required chart in ECharts examples and adjust it directly in the website editor. But keep in mind, that some examples use a function to fill the data. This is not possible to use in Dynamic App. You have to use an example with static data and then replace them in business action.
In 2024, ECharts library imported into Dynamic App is in version 5.4.3.
How to configure a diagram?
This example describes an usage of module samo-entity-diagram-widget, which has only general configuration and enables almost all types of charts to show in Dynamic App.
Important configuration property is options which should contain the chart data. Without templating and connecting with an action, it shows only static data.
    {
      "icon":"samo-icons-action:info",
      "title":"my SAMO chart",
      "module":{
        "type":"component:dynamic-app/modules/common/samo-entity-diagram-widget",
        "options": {
          "title":{
              "text":"Temperature Change in the Coming Week"
          },
          "tooltip":{
              "trigger":"axis"
          },
          "legend":{

          },
          "toolbox":{
              "show":true,
              "feature":{
                "dataZoom":{
                    "yAxisIndex":"none"
                },
                "dataView":{
                    "readOnly":false
                },
                "magicType":{
                    "type":[
                      "line",
                      "bar"
                    ]
                },
                "restore":{

                },
                "saveAsImage":{

                }
              }
          },
          "xAxis":{
              "type":"category",
              "boundaryGap":false,
              "data":[
                "Mon",
                "Tue",
                "Wed",
                "Thu",
                "Fri",
                "Sat",
                "Sun"
              ]
          },
          "yAxis":{
              "type":"value",
              "axisLabel":{
                "formatter":"{value} °C"
              }
          },
          "series":[
              {
                "name":"Highest",
                "type":"line",
                "data":[
                    10,
                    11,
                    13,
                    11,
                    12,
                    12,
                    9
                ],
                "markPoint":{
                    "data":[
                      {
                          "type":"max",
                          "name":"Max"
                      },
                      {
                          "type":"min",
                          "name":"Min"
                      }
                    ]
                },
                "markLine":{
                    "data":[
                      {
                          "type":"average",
                          "name":"Avg"
                      }
                    ]
                }
              },
              {
                "name":"Lowest",
                "type":"line",
                "data":[
                    1,
                    -2,
                    2,
                    5,
                    3,
                    2,
                    0
                ],
                "markPoint":{
                    "data":[
                      {
                          "name":"周最低",
                          "value":-2,
                          "xAxis":1,
                          "yAxis":-1.5
                      }
                    ]
                },
                "markLine":{
                    "data":[
                      {
                          "type":"average",
                          "name":"Avg"
                      },
                      [
                          {
                            "symbol":"none",
                            "x":"90%",
                            "yAxis":"max"
                          },
                          {
                            "symbol":"circle",
                            "label":{
                                "position":"start",
                                "formatter":"Max"
                            },
                            "type":"max",
                            "name":"最高点"
                          }
                      ]
                    ]
                }
              }
          ]
        }
    },
With an businnes action it gets more dynamic, you can get current data from the project. The data are loaded by prepareOptions configuration property.
There can be two types of actions:
- Entity action - typically for entity detail
- Service action - typically for dashboard
When creating a data objects, be careful about length of arrays - length of array series must be the same as in xAxis.
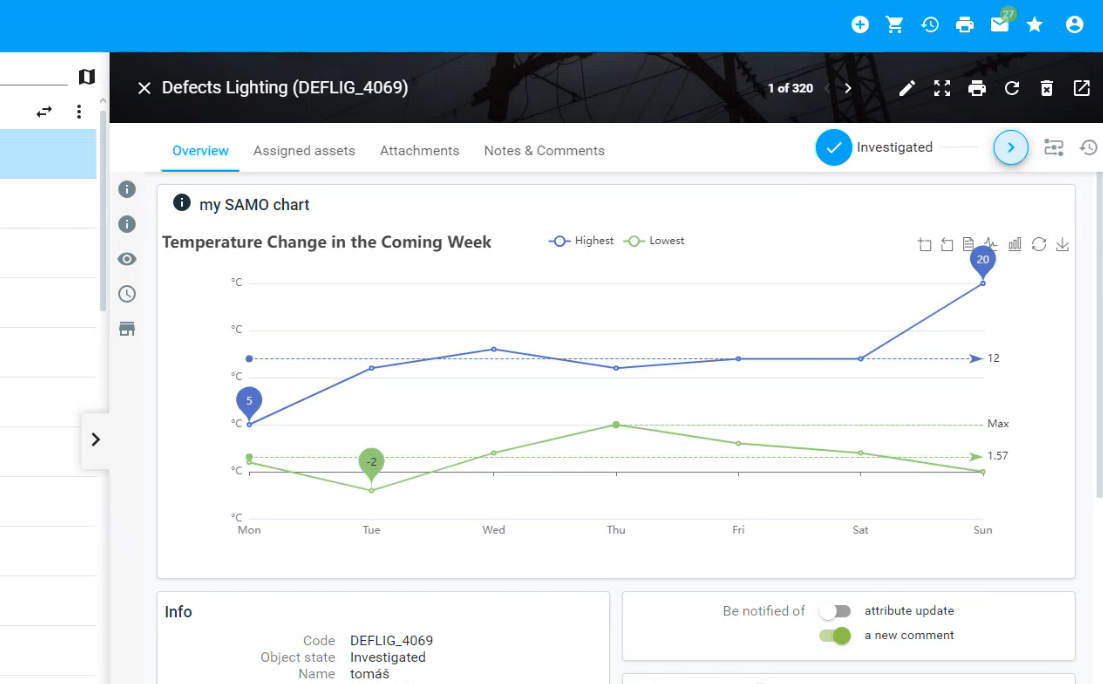
    "getDefectCharts": {
      "access": [
        "external",
        "instance",
        "static"
      ],
      "includeStates": [
        "*"
      ],
      "steps": [
        {
          "type": "script",
          "source": "{@packageRoot(@samo-demo/eam)}/scripts/defects/getDefectChart.js"
        }
      ]
    },
    function action(context) {
      // get data whatever you want (getFeatures, etc)
      //
      //
      var clientData = api.request().prepareCreateJSONRequestReader(context).create().getRequestBodyAsObject();

      var myData1 = [
        5,
        11,
        13,
        11,
        12,
        12,
        20
      ];

      // work with data, prepare array
      var clientResponse = api.response()
        .prepareCreateJSONResponse(context)
        .responseBody({
          options: {
            "title":{
              "text":"Temperature Change in the Coming Week"
            },
            "tooltip":{
              "trigger":"axis"
            },
            "legend":{

            },
            "toolbox":{
              "show":true,
              "feature":{
                  "dataZoom":{
                    "yAxisIndex":"none"
                  },
                  "dataView":{
                    "readOnly":false
                  },
                  "magicType":{
                    "type":[
                        "line",
                        "bar"
                    ]
                  },
                  "restore":{

                  },
                  "saveAsImage":{

                  }
              }
            },
            "xAxis":{
              "type":"category",
              "boundaryGap":false,
              "data":[
                  "Mon",
                  "Tue",
                  "Wed",
                  "Thu",
                  "Fri",
                  "Sat",
                  "Sun"
              ]
            },
            "yAxis":{
              "type":"value",
              "axisLabel":{
                  "formatter":"{value} °C"
              }
            },
            "series":[
              {
                  "name":"Highest",
                  "type":"bar",
                  "data":myData1,
                  "markPoint":{
                    "data":[
                        {
                          "type":"max",
                          "name":"Max"
                        },
                        {
                          "type":"min",
                          "name":"Min"
                        }
                    ]
                  },
                  "markLine":{
                    "data":[
                        {
                          "type":"average",
                          "name":"Avg"
                        }
                    ]
                  }
              },
              {
                  "name":"Lowest",
                  "type":"line",
                  "data":[
                    1,
                    -2,
                    2,
                    5,
                    3,
                    2,
                    0
                  ],
                  "markPoint":{
                    "data":[
                        {
                          "name":"周最低",
                          "value":-2,
                          "xAxis":1,
                          "yAxis":-1.5
                        }
                    ]
                  },
                  "markLine":{
                    "data":[
                        {
                          "type":"average",
                          "name":"Avg"
                        },
                        [
                          {
                              "symbol":"none",
                              "x":"90%",
                              "yAxis":"max"
                          },
                          {
                              "symbol":"circle",
                              "label":{
                                "position":"start",
                                "formatter":"Max"
                              },
                              "type":"max",
                              "name":"最高点"
                          }
                        ]
                    ]
                  }
              }
            ]
        }

          // return just data or whole series
        })
        .create();

      return api.result()
        .prepareCreateActionResult(context)
        .result(clientResponse)
        .create();
    }
    {
      "icon":"samo-icons-action:info",
      "title":"my SAMO chart",
      "module":{
        "type":"component:dynamic-app/modules/common/samo-entity-diagram-widget",
        "prepareOptions":{
          "type":"action",
          "actionId":"getDefectCharts"
        },
        "options":"{get:#options}"
      }
    },
You can return whole options from the action (as in examples above) or just a part of it and then template just this part from the response.