Reports
LIDS system supports reporting functionality for feature types including master-detail report types.
Reporting service is based on Jasper Reports tool. It is a Java based open-source reporting library with flexible data sources and wide range of output formats. Output formats include PDF, HTML, XLS, CSV or RTF. Data used to populate a report may be supplied either as input parameter from a user program, or as a data source defined within report.
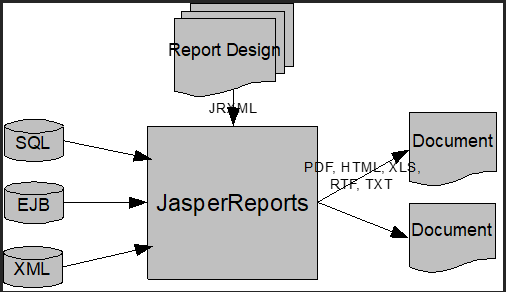
The report definitions are stored as a JasperReports templates.
The application server fills those templates with a concrete data when a request on a report is invoked.
However, some additional metadata is needed to make the report template fully functional. The reporting service is configured by reportArray element in presentation.xml file. Reporting service reads configuration from this file including jasper report template file location.
Reporting Services Architecture
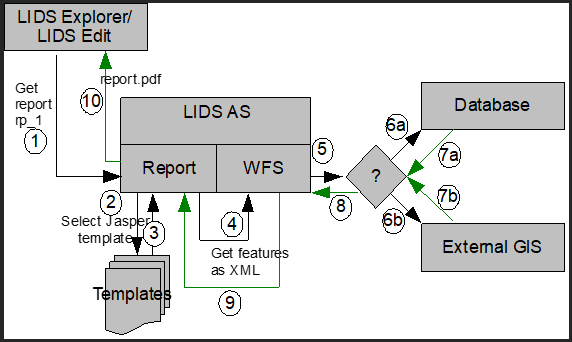
The architecture behind reporting service is a classical 3-tier architecture:
-
The user may select a particular report template within client application including output format of the response.
-
A report request is sent to the LIDS Application Server.
-
Application server selects an appropriate JasperReports template and sends a query to the storage engine.
-
The data returned from storage is used by LIDS Application Server to populate the report.
-
The report is outputted in specified format to the response.
-
Client application receives the response and opens it the associated viewer.
Reports Kinds
Currently LIDS Application Server supports various kinds of reports classified by following properties:
-
Static or dynamic
-
Simple or masterDetail
-
WFS based or SQL based
| Report type | Dynamic | MasterDetail | WFS based | SQL based |
|---|---|---|---|---|
| staticReport | No | No | Yes | No |
| dynamicReport | Yes | No | Yes | No |
| masterDetailReport | No | Yes | Yes | No |
| dynamicMasterDetailReport | Yes | Yes | Yes | No |
| jasperReport | No | Yes | No | Yes |
| dynamicJasperReport | Yes | Yes | No | Yes |
SQL based report data source
The data source for reporting is specified by writing SQL statement directly.
WFS based report data source
The data source for reporting is an XML document generated by the Web Feature Service. This brings advantages compared to the direct database querying approach:
-
All security constrains are applied
-
Independent of data layer (LIDS native SQL-database, external GIS)
-
Virtual attributes are evaluated during request processing
-
Designing the reports using metadata entities not the database tables/columns
However, this scenario brings a significant disadvantage when designing complex multi-join reports. Every detail section of master-detail reports must be modelled as an association.
Static reports
A static report definition has a static defined report template including query that selects the data. It means that the layout of the report will always look the same (the same data fields) and contain the same type of data (particular feature types and their attribute columns). This type of reports may be useful for features that change over the time. This is the simplest possible report to create.
Dynamic reports
The report template is dynamically modified by the request sent from client as well as query that selects the data. User usually selects a list of features from client application and sends a report request for these features. The report template is modified to include feature specific attributes, custom title etc.
This type of reports is very complex and difficult to create. Jasper report templates for these reports should be designed to be able to visualize all kinds of feature types and unlimited number of attribute columns. The LIDS Application Server contains universal set of dynamic reports with portrait and landscape layout; therefore these report templates should be sufficient for most cases and projects.
Master–detail reports
Master–detail reports are special kind of static reports that contains detail section for every master record. It represents master-detail view on data using feature associations.
Dynamic MasterDetail report is same as MasterDetail report, but features from master role are given by ogc filter in report service request and feature types of master role of the relation assoc.
Reporting Service Metadata
Besides report template (JasperReports XML-file) the application server needs to know additional information for each report template. Generally, these metadata tell the reporting service the name of the report, its description, name of the report template file, supported output formats and user defined parameters. Each type of report has also several other properties.
Dynamic reports
Dynamic reports are identified by dynamicReport element followed by report identifier, its displayable name and page orientation.
-
description element contains simple description of this report.
-
outputFormatArray contains outputFormat elements that defines possible formats of report files. The output format element has one optional attribute named default which is set to false as default. If the report request does not specify output format, then default one is taken.
-
inputParameterArray contains a list of inputParameter elements. Users may set these parameters in report request. Parameters are then used inside jasper report templates. The common usage for these parameters is report title, page footers, employee id etc. The id attribute serves as a unique identifier inside each report and needs to be referenced from jasper report template with exactly the same name. name attribute is a displayable name of this attribute used inside client environment. nillable attribute defines, if is a parameter is mandatory or not. description and defaultValue elements are self-explaining. dataType defines data type of parameter. Currently supported data types include decimal, string, date and codeListRefExt for codelist reference.
-
templateName contains jasper template file name which is located inside resources/report directory.
-
attributeTemplateName contains XML Stylesheet file name located inside resources/report directory. This file transforms jasper template file for each report request and fills feature type name and attributes information.
Example: Dynamic report configuration (presentation.xml).
<ber:reportArray>
<ber:dynamicReport id="rp_1" name="Default Portrait" orientation="portrait" default="true">
  <ber:description>Default Portrait Report Template</ber:description>
  <ber:outputFormatArray>
    <ber:outputFormat default="true">pdf</ber:outputFormat>
    <ber:outputFormat>html</ber:outputFormat>
    <ber:outputFormat>csv</ber:outputFormat>
    <ber:outputFormat>xls</ber:outputFormat>
  </ber:outputFormatArray>
  <ber:inputParameterArray>
    <ber:inputParameter id="TITLE" name="Report Title">
      <ber:description>The report title</ber:description>
      <ber:defaultValue>Feature Report</ber:defaultValue>
    </ber:inputParameter>
    <ber:inputParameter id="MODEL_NAME" name="Model Name">
      <ber:description>The name of the project (footnote)</ber:description>
      <ber:defaultValue>LIDSdemo</ber:defaultValue>
    </ber:inputParameter>
    <ber:inputParameter id="DATE1" name="Some date">
      <ber:description>Date for filtering the data</ber:description>
      <ber:defaultValue>2010-10-01 23:59:59</ber:defaultValue>
      <ber:dataType>
        <ber:date/>
      </ber:dataType>
    </ber:inputParameter>
    <ber:inputParameter id="DATE2" name="Some date">
      <ber:description>Date for filtering the data</ber:description>
      <ber:defaultValue>
        <ber:currentDate/>
      </ber:defaultValue>
      <ber:dataType>
        <ber:date/>
      </ber:dataType>
    </ber:inputParameter>
    <ber:inputParameter id="YEAR" name="Report Year" nillable="false">
      <ber:description>Used as title text</ber:description>
      <ber:defaultValue>2013</ber:defaultValue>
      <ber:dataType>
        <ber:decimal precision="4" scale="0"/>
      </ber:dataType>
    </ber:inputParameter>
    <ber:inputParameter id="MATERIAL" name="Material type">
      <ber:description>Used for material type</ber:description>
      <ber:dataType>
        <ber:codeListRefExt>
          <ber:codeList xlink:href="model.xml#cl_204"/>
          <ber:displayColumn xlink:href="model.xml#ca_20402"/>
        </ber:codeListRefExt>
      </ber:dataType>
    </ber:inputParameter>
  </ber:inputParameterArray>
  <ber:templateName>default.template.jrxml</ber:templateName>
  <ber:attributeTemplateName>default.template.xsl</ber:attributeTemplateName>
</ber:dynamicReport>
Relative path to resources
It’s possible to include resources in reports by specifying the path relative to application or resource root.
Two new string parameters can be used now:
$P{APPLICATION_ROOT} - root of LIDS metadata
or
$P{RESOURCE_ROOT} - root of LIDS resources) in your path
Don't forget to declare parameter in your report:
<parameter name="RESOURCE_ROOT" isForPrompting="false" class="java.lang.String"/>
Example of usage:
<imageExpression><![CDATA[$P{RESOURCE_ROOT}+"/report/file.jpg"]]></imageExpression>
Packaged project will use relative path as for all other resources.
Limitations
-
Master–detail reports may contain only one level deep detail section.
-
Since data are processed sequentially the charting functionality is limited. Charts use so-called groups of ordered data.
-
In case of jasperReport and dynamicJasperReport the user access rights are not evaluated.
Creating Simple Report
The simplest approach is to create a report template using JasperSoft Studio design tool – an open-source WYSIWYG report designer for JasperReports. It is used to design templates even with very complex layout.
This chapter describes step-by-step process how to create simple static report using JasperSoft Studio design tool, how to register such a report in LIDS Application Server environment and how to request that report within LIDS Explorer.
Creating report template using JasperSoft Studio
The iReport is capable of querying multiple data sources including databases using JDBC driver. Fortunately there is LIDS JDBC driver available that can process simple SQL-queries by translating them into wfs:GetFeature requests.

JasperSoft Studio supports basic SQL queries with WHERE, ORDER BY, GROUP BY, HAVING, and currently also single JOIN conditions.
JasperSoft Studio installation and setup
Download JasperSoft Studio from the following page:
http://community.jaspersoft.com/project/jaspersoft-studio/releases
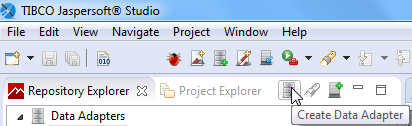
Install the application as usual and launch it.
First thing that needs to be done is to create data source for the report. Select Create Data Adapter.
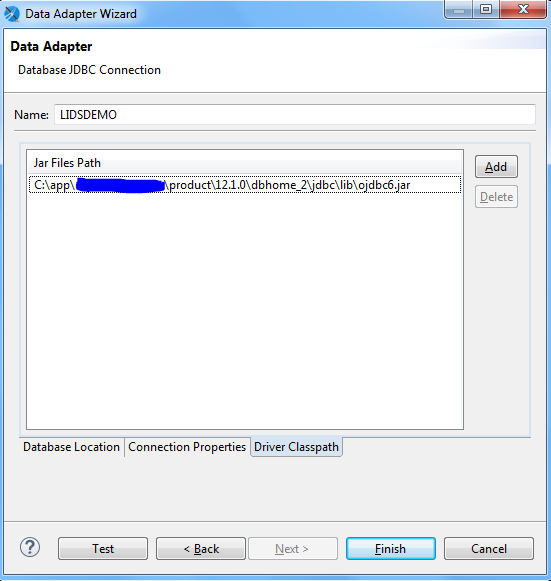
Inside the Data Adapter Wizard choose Database JDBC Connection and set connection to an existing database (lidsdemo) with your username and password:
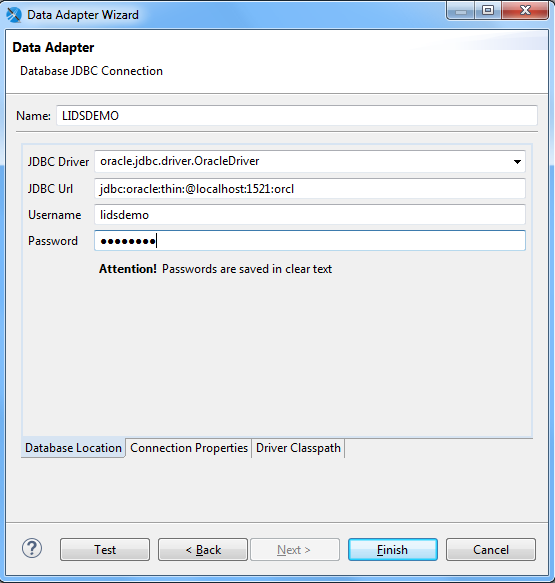
Then we need to install LIDS JDBC driver to be able to connect to the application server and acquire some data. Go to Driver Classpath, then click Add and set path to jar files. Finally, you can test your connection and click Finish.
Creating report
After creating the connection, you may create an actual report from scratch or use predefined templates:
From main menu select File → New → Jasper Report.
On next dialog select template (we recommend “Blank A4 Table based”), click Next. In the following dialog, fill in the name of the template. Default storage path for templates is usually: C:\Users\user_name\JaspersoftWorkspace\MyReports
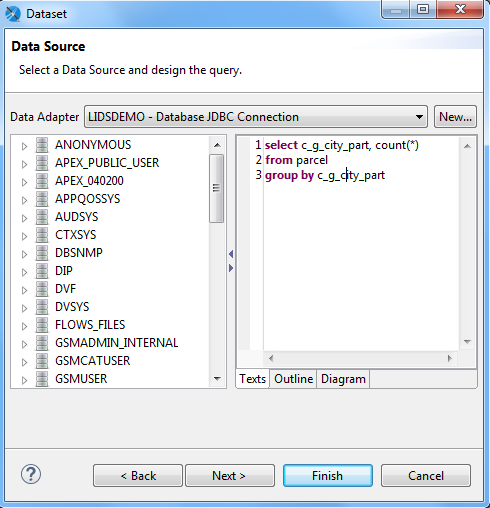
In the following Data Source dialog select your Data Adapter created before.
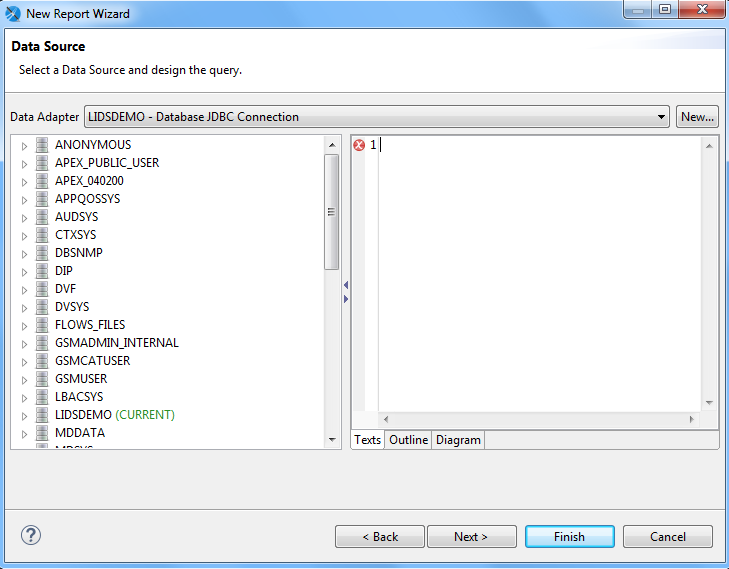
Now you need to specify the query that will select data from LIDS-system. You can write SQL query in tab Texts yourself, or you can use tab Outline, where you have predefined query structure and by right-click on the operator you can choose tables or expressions. The tab Diagram shows the query as a diagram. If you are unsure of available columns (attributes) select all of them by character.
Example: SQL query for static report.
SELECT c_g_city_part, COUNT(*)
FROM PARCEL
GROUP BY c_g_city_part;
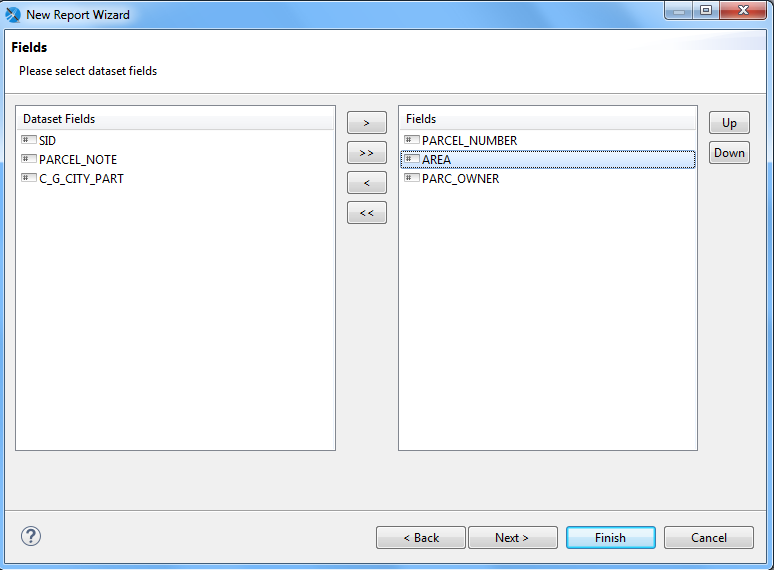
Proceed to the next step where you may select available columns. Select the columns you like using arrow icons. You can change order of fields with up and down buttons on the left.
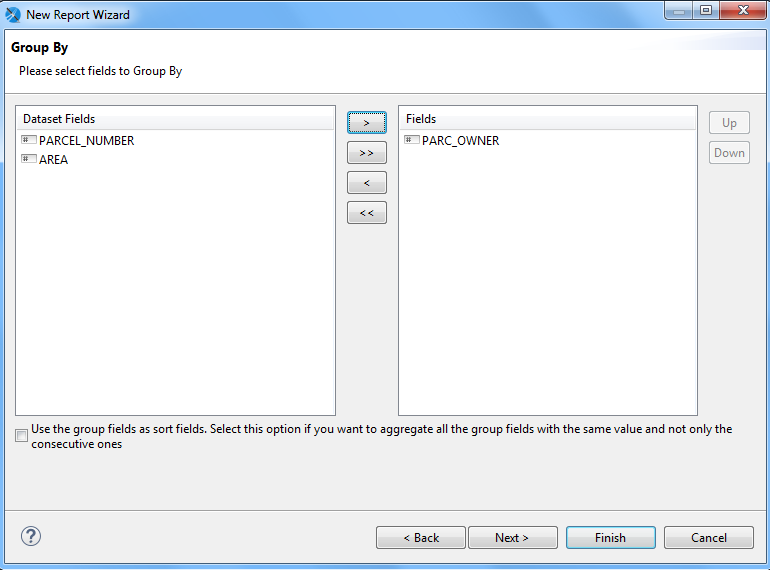
Next step allows you to group fields.
Click Finish. Your basic report template is created, and you may customize it to suit your needs. The template will be saved as a JRXML-file.
Viewing report result
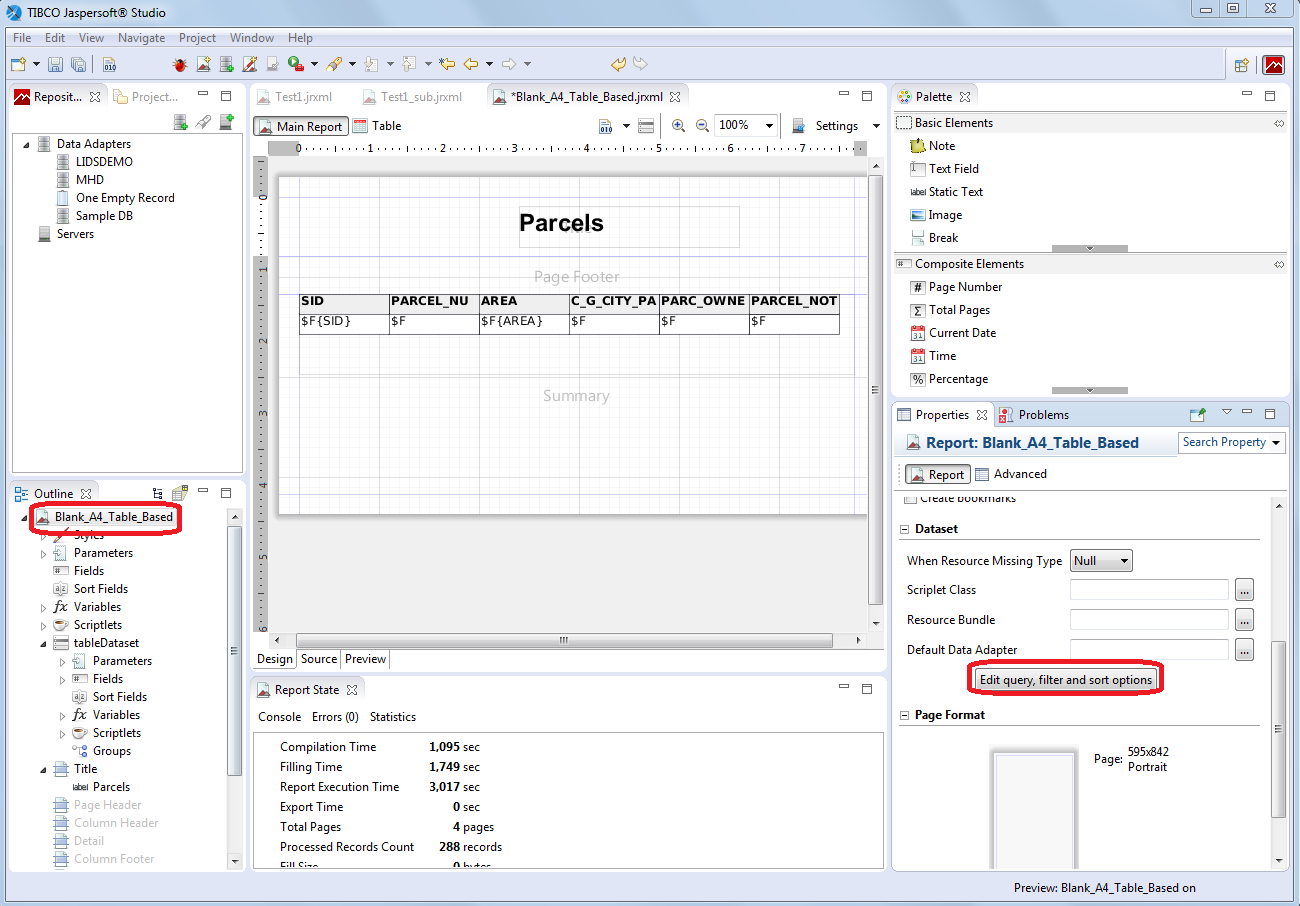
You may see the filled report with actual data inside JasperSoft Studio environment. There are three modes – Design, Source and Preview. Design mode allows you to modify your report, add or remove Fields, etc. In the Source mode you can see XML structure of the report and you can directly edit report definition and finally Preview mode generates preview of the report filled with actual data. In Preview mode, it’s possible to fill values for input parameters which are used in given report as well.
Extension and adjustment of the report layout
If you choose predefined template for your report, you will probably need to make some adjustments. If you use blank template, you will have to design your report from scratch. In Design mode, you can remove or add fields to your report, add some basic elements to layout and change formatting.
Ultimate button which enables you to change source data for the report is called “Edit, Query, Filter and sort options” and can be found in the Propertiespanel→ Report → Dataset (bottom – right) when selecting main node from the Outline panel (bottom – left).
In the dialog that appears, you can perform these operations:
-
specify a new SQL query
-
edit existing SQL query
-
update a list of fields for current query definition by means of Read Fields button
-
update individual fields properties in tab Fields in the bottom part of the dialog by means of Editbutton, e.g. field - description, field class type
-
add or edit attributes for sorting in tab Sorting in the bottom part of the dialog
-
view all and edit properties for custom parameters in tab Parameters in the bottom part of the dialog
-
run data preview based on current query definition
After clicking on OK button new or updated definition is used for selected report.
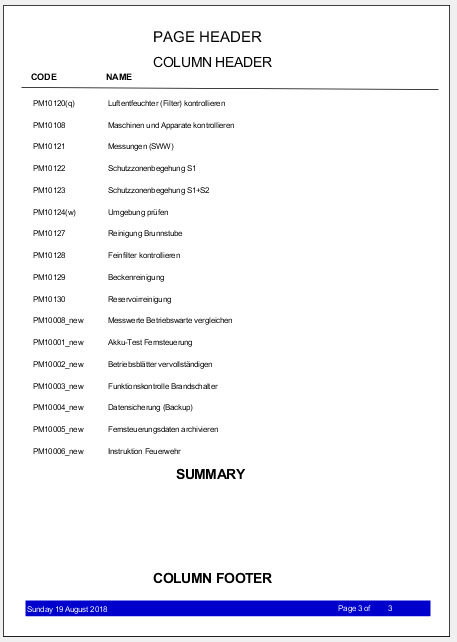
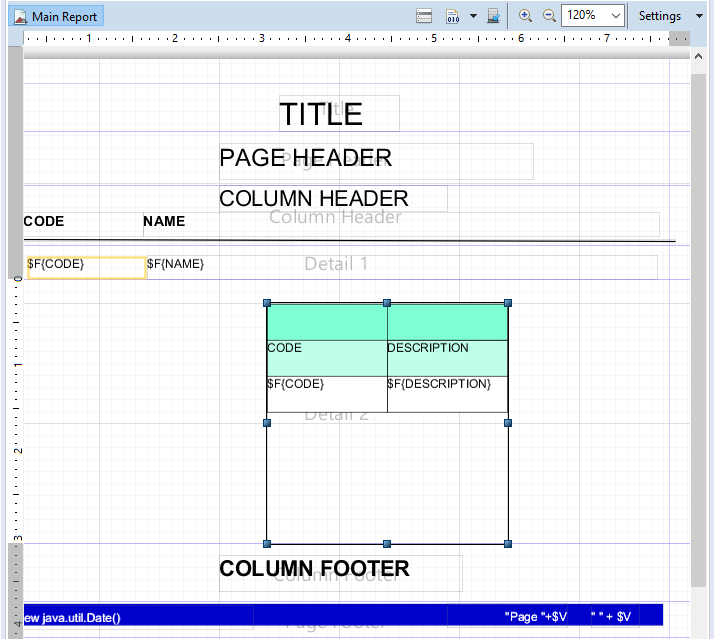
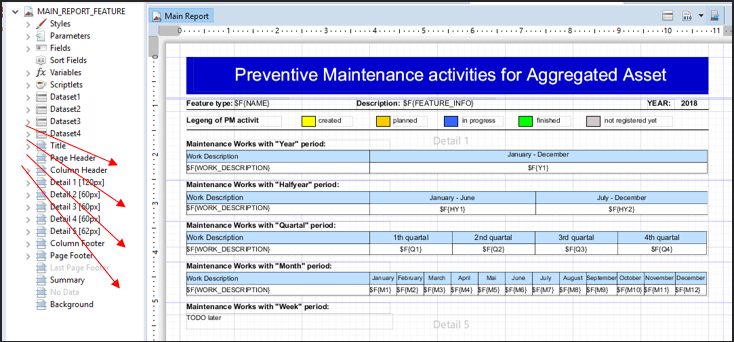
Layout of the report in main window is divided to multiple parts. Generally, report may be composed of these bands (parts):
-
Title – opening report title; it's created only once a report
-
Page Header – header of pages; the page header appears on all printed pages in the same position
-
Column Header – the column header band is printed at the beginning of each detail band
-
Detail – represents data content of report; report may contain more "detail" sections if report has subreports
-
Group Header – a report can contain zero or more group bands, which permit the collection of detail records in real groups. A group header is always accompanied by a group footer (both can be independently visible or not) different properties are associated with a group.
-
Group Footer – the group footer band completes a group; usually it contains fields to view subtotals or separation graphic elements, such as lines.
-
Column Footer – the column footer band appears on at the end of every detail band
-
Page Footer – the page footer band appears on every page where there is a page header
-
Summary – the summary band allows to insert fields concerning total calculations, means, or whatever you want to insert at the end of the report.
-
Last Page Footer – If you want to make the last page footer different from the other footers, it is possible to use the special last page footer band.
-
Summary – The summary band allows to insert fields concerning total calculations, means, or whatever you want to insert at the end of the report.
-
Background – The background band was introduced after insistent requests from many users who wanted to be able to create watermarks and similar effects.
On the picture below you can see an illustration of the standardly used bands for 3 pages report.
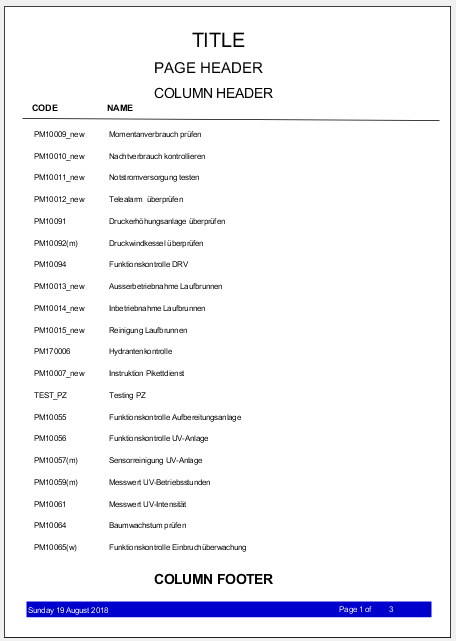
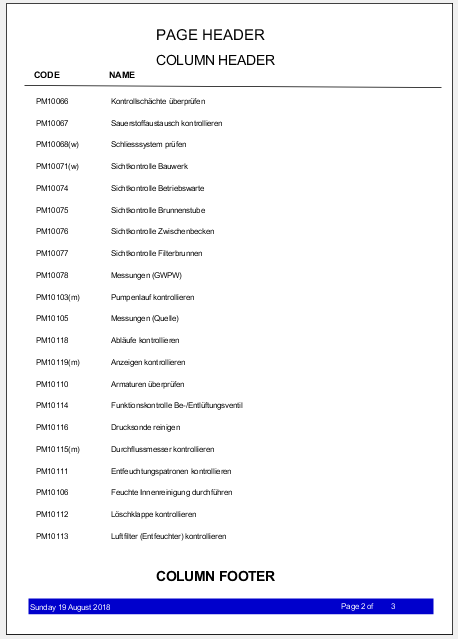
You can either remove some of bands or add another. By changing their width, you define the space between parts or single elements in the final report. For example, you need to change the width of Detail section to narrow (or remove) the space between table rows.
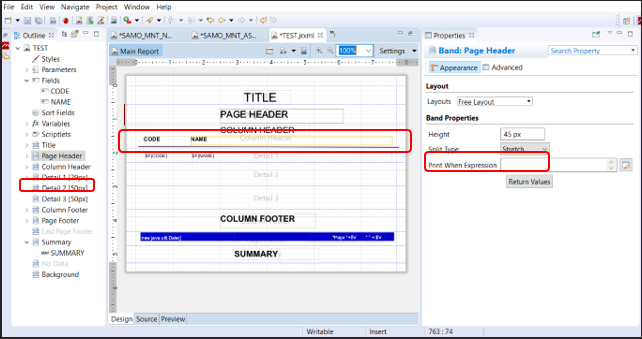
The best way to control the bands is via Outline panel. There is a list of bands and their components. After selecting one of the bands or component you can set the size or position by means of Properties panel (in Appearance tab) or with using of graphical elements in Design panel. You can also remove band or field from report by right-click on the field in layout or in Outline panel and then use Delete function.
If Outline panel is not available it's possible to activate it again from menu Window -> Show view -> Other ... select General -> Outline.
It is recommended to use blank templates because problem with background images may occur when exporting report from LIDS.
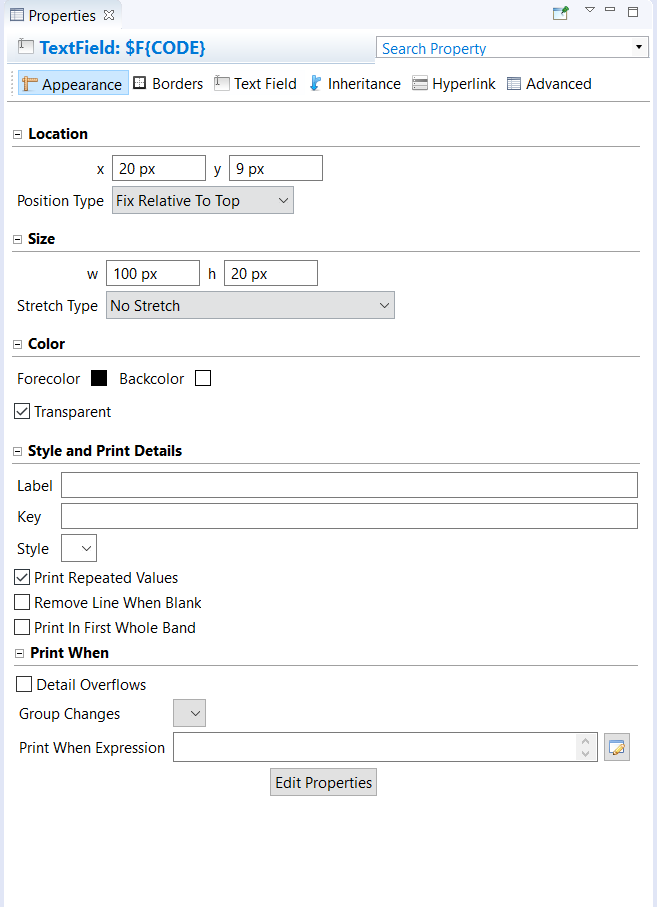
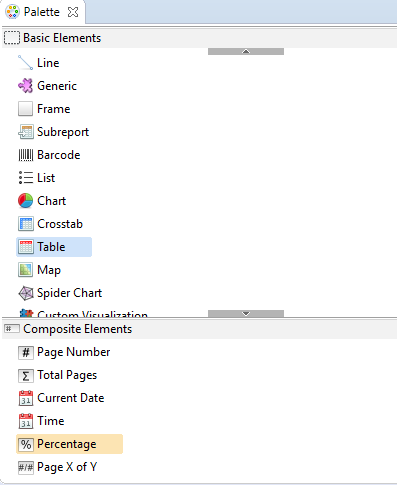
You can add Basic and Composite Elements to layout from Palette panel (up-right) by drag and drop. This contains for example Text Field, Static Text, Image, Break, Line, Chart, Map, Frame, Rectangle, Subreport, Page number and other. For every field object in the layout JasperSoft Studio creates a text field element and sets the text field expression for that element to $F{NAME}. This text can be further formatted in Properties → TextField → Appearance.
If you use blank template, you have to add all fields to layout yourself. You can do that just by dragging them from the list in Fieldssection in Outlinepanel to the main window to Detail section. Automatically there will be also headers created in Column header section.
For each report element is possible to set many properties. The best way how to set or edit properties is to use Propertiespanel. The enumeration of properties is very wide and is divided to several tabs in the panel – as you can see on the picture below. Detail description of individual properties can be found in JasperSoft Studio help.
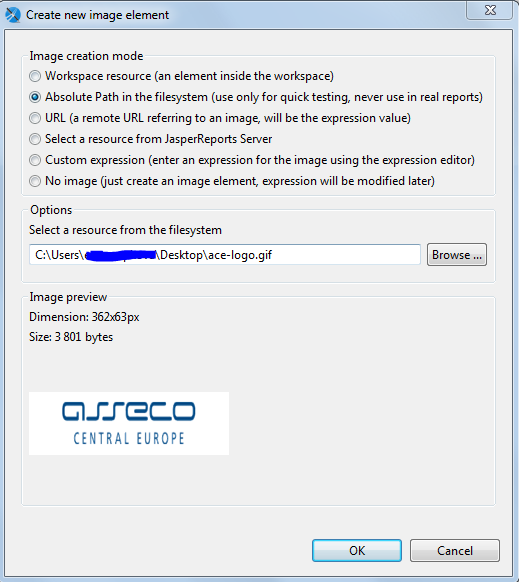
Inserting company logo
You can enrich your report with images, for example your company´s logo.
- Choose Image from Basic Elements in Palette and drag it to the section of your choice. The following dialog appears:
-
Select Absolute Path and choose the path to your picture, which should be stored on your local driver. Click OK.
-
You can now move and resize your picture, either with mouse or in the Properties panel.
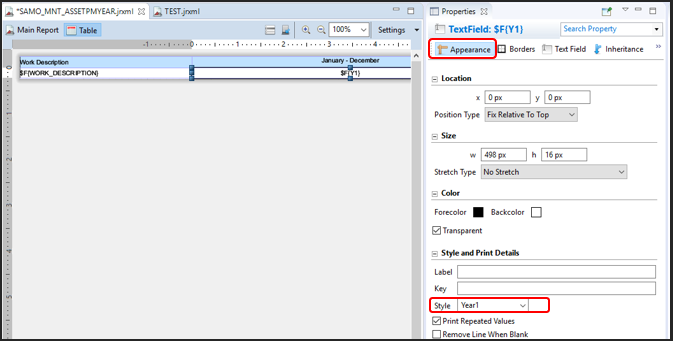
Using styles and conditional styles
It can be useful to define styles for repeated use for more report elements. Creating new style is possible from Outline panel, under the Styles list a function Create style is available. Then you can define or adjust style characteristics via Properties panel.
If you want to define conditional style first create style and then from context menu over created style choose Create conditional style. Then it’s necessary to define condition via Expression Editor dialog (e.g. $F{ATTRIBUTE1}=0 ) and finally you can define or adjust style characteristics via Properties panel.
Assigning the style to some report element is done using Properties panel as well. After selecting given report element use Appearance tab and then select required style by means of Style combobox.
Using more datasets in report – using of Table element
If you want to create report with more queries (with more various datasets) you can utilize Table element for it. The procedure how to add and configure “table” dataset and layout is below.
- Choose Table from Basic Elements in Palette and drag it to the section of your choice (typically to some Detailband).
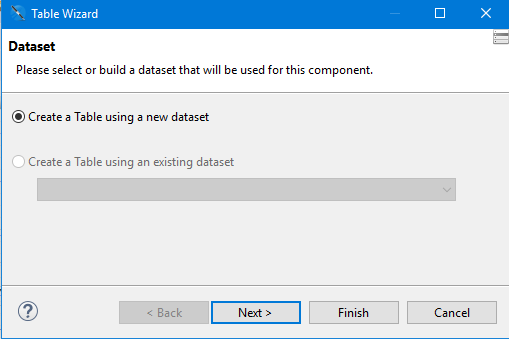
- The following dialog appears. You will probably have to choose creating table using a new dataset. Click on Nextbutton.
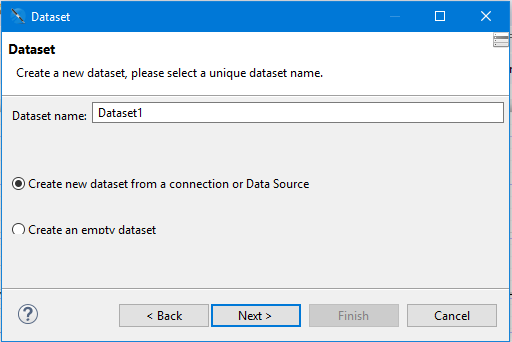
- Enter name for new dataset (you can use the name predefined by system). Click on Nextbutton.
- Select the Data Adapterand then definition of the query is same as when creating a report (see chapter 18.5.1.2 step 4). Click on Nextbutton always.
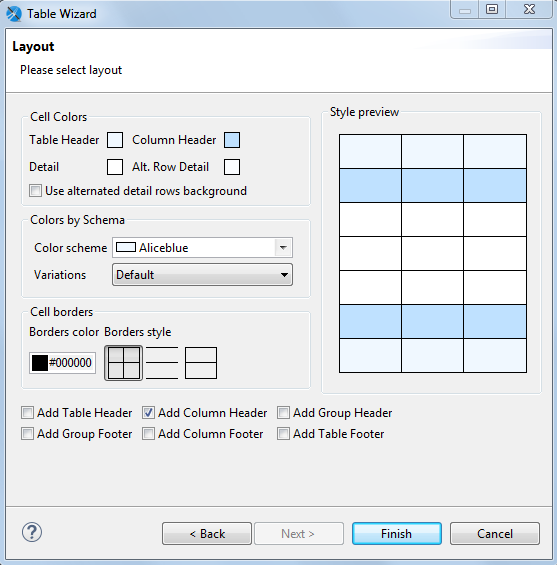
- Last dialog allows you to set/modify simple formatting for the table. At the bottom of the dialog checkboxes for activating/deactivating table sections are available. Set them according to your needs (typically based on dataset definition, e.g. Group Header and Group Footer has sense only if dataset uses grouping). Next sections in the dialog allow to set color schema or color definition for individual table sections, style for cell borders etc. Finish whole procedure by clicking on Finish button. The table will be added to the selected band.
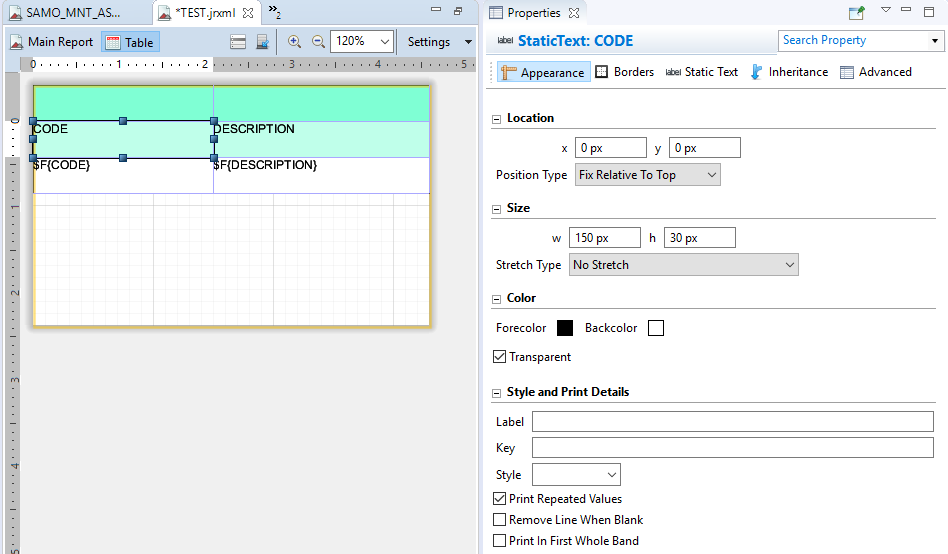
- You can get the similar result as on picture below. The table element is placed to selected band with chosen colour schema and with predefined size and position. In Outlinepanel new “dataset” and “table” elements are added automatically as well.
- Tuning of all table and table cells properties is possible by double click on given table. Design tab for table appears and individual properties can be modified both in graphic window or by means of Propertiespanel for selected row, column or cell.
- Example report with 4 tables (datasets), each placed in separate detail band you can see on picture below.
Creating report with subreports
If you want to create report with subreport – it means with part which displays data from subquery related to records from main report query – you can use 2 basic techniques.
a/ Creating subreport with using Table element
Table element can be used for subreport as well. Place and adjust Table element in the similar way as described in "Using more datasets in report – using of Table element" chapter. If you use Table element for subreport there are two important things to do:
- Use proper parameter in table dataset query for interconnection between subrecords and record from main query. Example of dataset query is:
SELECT fk_attribute, attribute1, attribute2, ...
FROM table
WHERE table.fk_attribute = $P{input_parameter_for_interconnection}
where $P{input_parameter_for_interconnection} is parameter defined under given Dataset
-
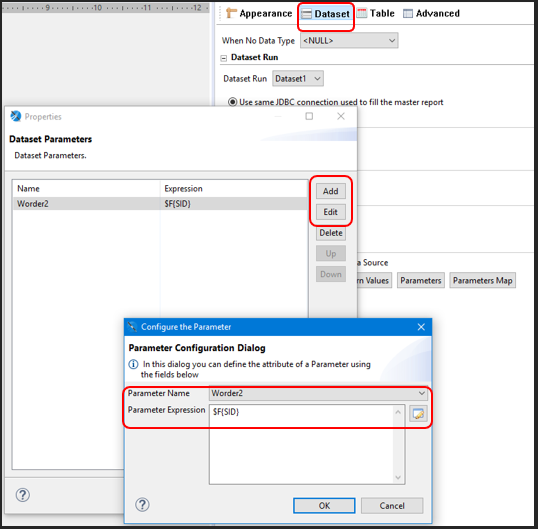
Then it is necessary to define “mapping” of parameters. For this operation you can use these steps:
-
Find element Table in given Detail band and click on it to display Properties panel
-
In Properties panel switch to Dataset tab and use Parameters button
-
Click on Add or Edit button, select appropriate parameter and fill in proper Parameter Expression, typically in this syntax $F{attribute_from_main_query}, e.g. $F{SID} – see on picture below.
b/ Creating subreport using Subreport element
Select Subreport element from Palette and use these steps from dialog for creating subreport:
-
Create a new report
-
Select report template
-
Select or fill in report file name
-
Select data adapter
-
Define query – in query you should define clause which ensure interconnection between subreport and main report; typically by means of parameter used in WHERE condition, e.g. WHERE fk_attribute = $P{Norma}, where fk_attribute can be foreign key from subqeury table pointing on primary key in main query table
-
Select report fields and group by fields
-
Specify connection
-
Add dataset parameters – add parameter(s) used within query for interconnection between subreport and main report
After clicking on Finish button subreport element is created and added to selected detail band. Then it is necessary to define “mapping” of parameters. For this operation you can use these steps:
-
Find element Subreport in given Detail band and click on it to display Properties panel
-
In Properties panel switch to Subreport tab and use Edit Parameters button
-
Click on Add or Edit button, select appropriate parameter and fill in proper Parameter Expression, typically in this syntax $F{attribute_from_main_query}, e.g. $F{SID}.
Dynamic reports
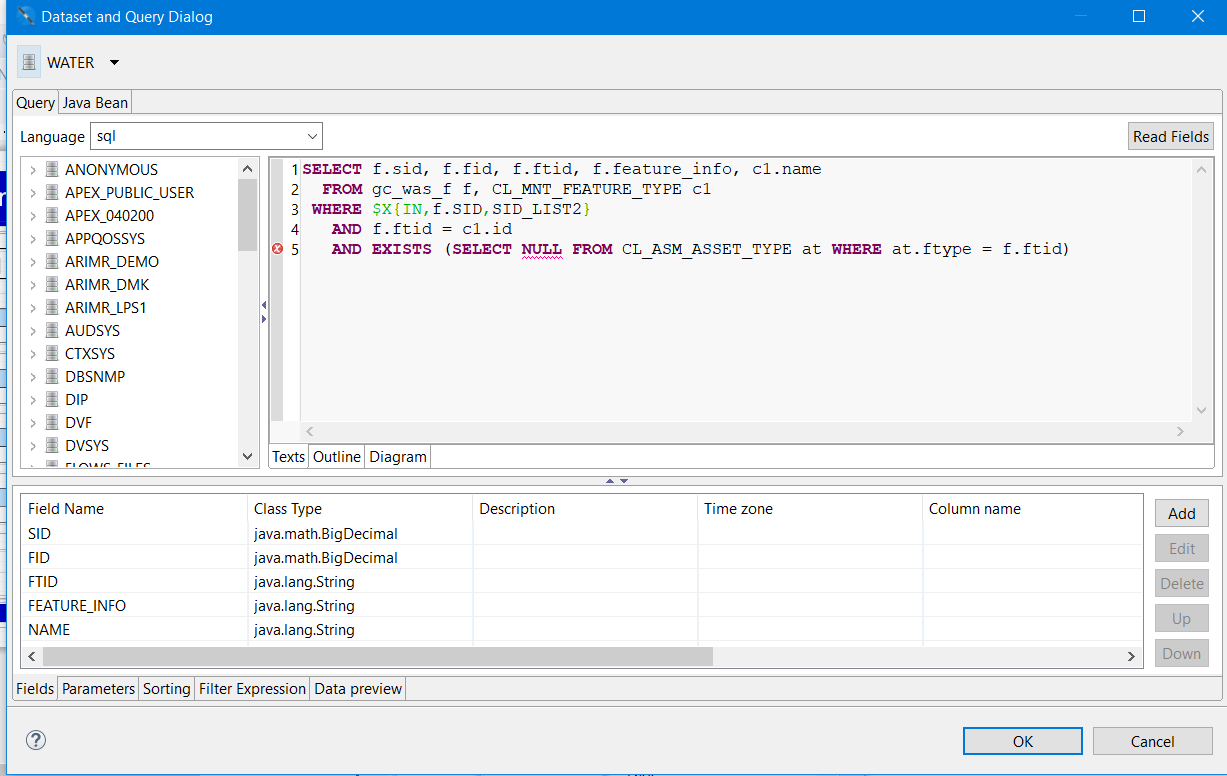
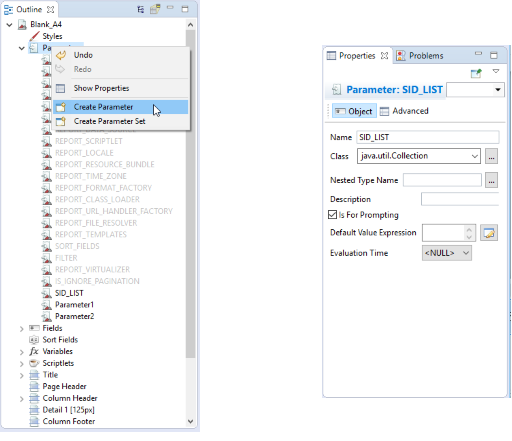
Several changes must be made to report template in order to create a dynamic report. For dynamic reports, it is necessary to define and use SID_LIST report parameter. It is a collection of LIDS features SID values. They will be provided dynamically by user when performing the report. The SID_LIST definition and usage is illustrated at following pictures.
If this type of report is requesting on the server, in the request are defined WFS queries. In report filling process, parameter SID_LIST will be filled with collection of SIDs of feature collection responded from WFS.
SID_LIST parameter is defined as java.util.Collection class. If this class cannot be found in combobox list fill down the value manually.
SID_LIST parameter also needs to be used in Query. Here sid is column name in LIDS DB table w_pumpstat. $X{IN, sid, SID_LIST} means ‘sid IN SID_LIST’ but must be written this way as this is JasperReports collection syntax.
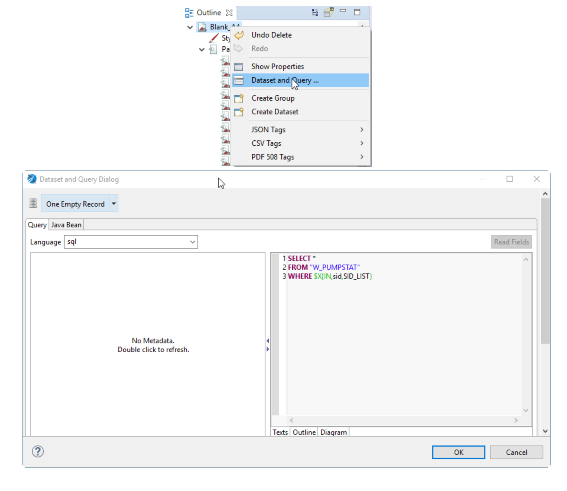
Example: SQL query for dynamic report.
SELECT*
FROM W_PUMPSTAT
WHERE $X{IN, sid, SID_LIST};
Registering report inside LIDS Application Server
When you are satisfied with your report template design, you may place that report inside LIDS Application Server to make the report available in LIDS Explorer. This section describes the steps needed to accomplish this task.
JasperSoft Studio reports
Report type JasperReport allows to generate report from native jasper report template format which uses sql query language. Data are queried directly from database.
Example: Static report (Blank_A4_jasper.jrxml) from JasperSoft Studio.
http://jasperreports.sourceforge.net/xsd/jasperreport.xsd" name="Blank_A4_jasper" pageWidth="595" pageHeight="842" columnWidth="555" leftMargin="20" rightMargin="20" topMargin="20" bottomMargin="20" uuid="6360915a-5381-42a6-9553-dec75020a510">
 <property name="com.jaspersoft.studio.data.sql.tables" value=""/>
 <property name="com.jaspersoft.studio.data.defaultdataadapter" value="LIDSDEMO"/>
 <queryString language="SQL">
  <![CDATA[SELECT "W_PUMPSTAT"."X_COORD",
 "W_PUMPSTAT"."Y_COORD"
FROM "W_PUMPSTAT"]]>
 </queryString>
 <field name="X_COORD" class="java.math.BigDecimal"/>
 <field name="Y_COORD" class="java.math.BigDecimal"/>
 <background>
  <band splitType="Stretch"/>
 </background>
 <title>
...
 <textFieldExpression><![CDATA["NADPIS"]]></textFieldExpression>
...   <textFieldExpression><![CDATA[$F{X_COORD}]]></textFieldExpression>
...   <textFieldExpression><![CDATA[$F{Y_COORD}]]></textFieldExpression>
...
</jasperReport>
Example: Dynamic report (Blank_A4_jasper.jrxml) from JasperSoft Studio.
<?xml version="1.0" encoding="UTF-8"?>
<!-- Created with Jaspersoft Studio version 6.3.1.final using JasperReports Library version 6.3.1  -->
<!-- 2017-03-13T16:50:32 -->
<jasperReport xmlns="http://jasperreports.sourceforge.net/jasperreports" xmlns:xsi="http://www.w3.org/2001/XMLSchema-instance" xsi:schemaLocation="http://jasperreports.sourceforge.net/jasperreports http://jasperreports.sourceforge.net/xsd/jasperreport.xsd" name="Blank_A4_jasper_dyn" pageWidth="595" pageHeight="842" columnWidth="555" leftMargin="20" rightMargin="20" topMargin="20" bottomMargin="20" uuid="6360915a-5381-42a6-9553-dec75020a510">
 <property name="com.jaspersoft.studio.data.sql.tables" value=""/>
 <property name="com.jaspersoft.studio.data.defaultdataadapter" value="One Empty Record"/>
 <parameter name="SID_LIST" class="java.util.Collection">
  <defaultValueExpression><![CDATA[]]></defaultValueExpression>
 </parameter>
 <queryString language="SQL">
  <![CDATA[SELECT *FROM "W_PUMPSTAT"
WHERE $X{IN,sid,SID_LIST}]]>
 </queryString>
 <field name="X_COORD" class="java.math.BigDecimal"/>
 <field name="Y_COORD" class="java.math.BigDecimal"/>
...
</jasperReport>
Application Server and Presentation.xml
After you are done with report customizations place the JasperReports template (.jrxml file) insideResources/Reportdirectory of the LIDS Application Server.
The last thing that needs to be done is to register a newly created report inside projectPresentation.xmlfile. These reports are labelled as <ber:jasperReport> and <ber:dynamicJasperReport>.
Example: Registration of static reportBlank_A4_jasper.jrxmlinsidepresentation.xml.
    <ber:jasperReport id="jrp_tibco" name="Test TIBCO Jasper" orientation="portrait">
      <ber:description>report in jasper format</ber:description>
      <ber:outputFormatArray>
        <ber:outputFormat default="true">pdf</ber:outputFormat>
        <ber:outputFormat>html</ber:outputFormat>
        <ber:outputFormat>csv</ber:outputFormat>
        <ber:outputFormat>xls</ber:outputFormat>
      </ber:outputFormatArray>
      <ber:templateName>Blank_A4_jasper.jrxml</ber:templateName>
    </ber:jasperReport>
Example: Registration of dynamic reportBlank_A4_jasper_dyn.jrxmlinsidepresentation.xml.
 <ber:dynamicJasperReport id="dyn_pump" name="Pumping station" orientation="portrait">
      <ber:description>SID test of dynamic jasper</ber:description>
      <ber:outputFormatArray>
        <ber:outputFormat default="true">pdf</ber:outputFormat>
        <ber:outputFormat>html</ber:outputFormat>
        <ber:outputFormat>csv</ber:outputFormat>
        <ber:outputFormat>xls</ber:outputFormat>
      </ber:outputFormatArray>
      <ber:templateName>Blank_A4_jasper_dyn.jrxml</ber:templateName>
      <ber:featureTypeArray>
        <ber:featureType xlink:href="model.xml#ft_5010100"/>
      </ber:featureTypeArray>
    </ber:dynamicJasperReport>
Report from software iReport
A few modifications to the report template must be done if the report is created in older software e.g. iReport 5.6.0. You have to replace database names with metadata identifications of these attributes. Open the report template JRXML-file with your favourite text editor.
If you rename the JasperReports template file, be sure that the name attribute inside jasperReport element contains the same name.
Find field elements section and for each field do the following:
- Change the name of the field to the metadata identification:
-
If it is a feature system attribute, prefix it with /@.
Example: createDate → /@createDate
-
If it an ordinary feature attribute that is not of a codelist type, change it to suit the
*/<at_identifier>format.Example: LENGTH →/at_52013
-
If it is a codelist feature attribute, change it to suit the
*/<at_identifier>/<codelist_display_column>format.Example: C_G_CITY_PART → /at_5010004/ca_00402
-
If the class attribute contains anything else than java.lang.String, change it to the java.lang.String value.
-
Search for textFieldExpression element that contains the old name of the field and change the value to the new one.
-
If the class attribute of the textFieldExpression element contains anything else than java.lang.String, change it to the java.lang.String value.
Application Server and Presentation.xml
After you are done with report customizations place the JasperReports template (.jrxml file) inside Resources/Report directory of the LIDS Application Server.
The last thing that needs to be done is to register a newly created report inside project Presentation.xml file. These reports are labelled as <ber:staticReport>, <ber:dynamicReport>, <ber:masterDetailReport> or <ber:dynamicMasterDetailReport>.
Example: Static report section may look like the following.
<ber:staticReport id="rp_my" name="Main Pipeline Segment Report" orientation="portrait">
      <ber:description>Main Pipeline Segment Report</ber:description>
      <ber:outputFormatArray>
        <ber:outputFormat default="true">pdf</ber:outputFormat>
        <ber:outputFormat>html</ber:outputFormat>
        <ber:outputFormat>csv</ber:outputFormat>
        <ber:outputFormat>xls</ber:outputFormat>
      </ber:outputFormatArray>
      <ber:templateName>my_report.jrxml</ber:templateName>
      <ber:reportQueryArray>
        <ber:reportQuery>
          <ber:featureType xlink:href="model.xml#ft_5012100"/>
          <ber:attributeArray>
            <ber:attribute xlink:href="model.xml#at_5010004"/>
            <ber:attribute xlink:href="model.xml#at_5012002"/>
            <ber:attribute xlink:href="model.xml#at_5012102"/>
          </ber:attributeArray>
          <ogc:Filter>
            <ogc:PropertyIsBetween>
              <ogc:PropertyName>at_5012102</ogc:PropertyName>
              <ogc:UpperBoundary>
                <ogc:Literal>9003</ogc:Literal>
              </ogc:UpperBoundary>
              <ogc:LowerBoundary>
                <ogc:Literal>9000</ogc:Literal>
              </ogc:LowerBoundary>
            </ogc:PropertyIsBetween>
          </ogc:Filter>
        </ber:reportQuery>
        <ber:orderBy>
          <ber:orderByItem direction="ascending">
            <ber:commonAttribute attributeName="at_5012102">
              <ber:featureType featureTypeName="ft_5012100"/>
            </ber:commonAttribute>
          </ber:orderByItem>
        </ber:orderBy>
      </ber:reportQueryArray>
    </ber:staticReport>
Testing report
The report should be available in client application. However, if you want to test the report if it works properly, you can use LIDS Ultra Light Client that can be found on http://<LIDS_AS_URL>/utils/request.html address. Report Service section allows the user to query the server for reports.